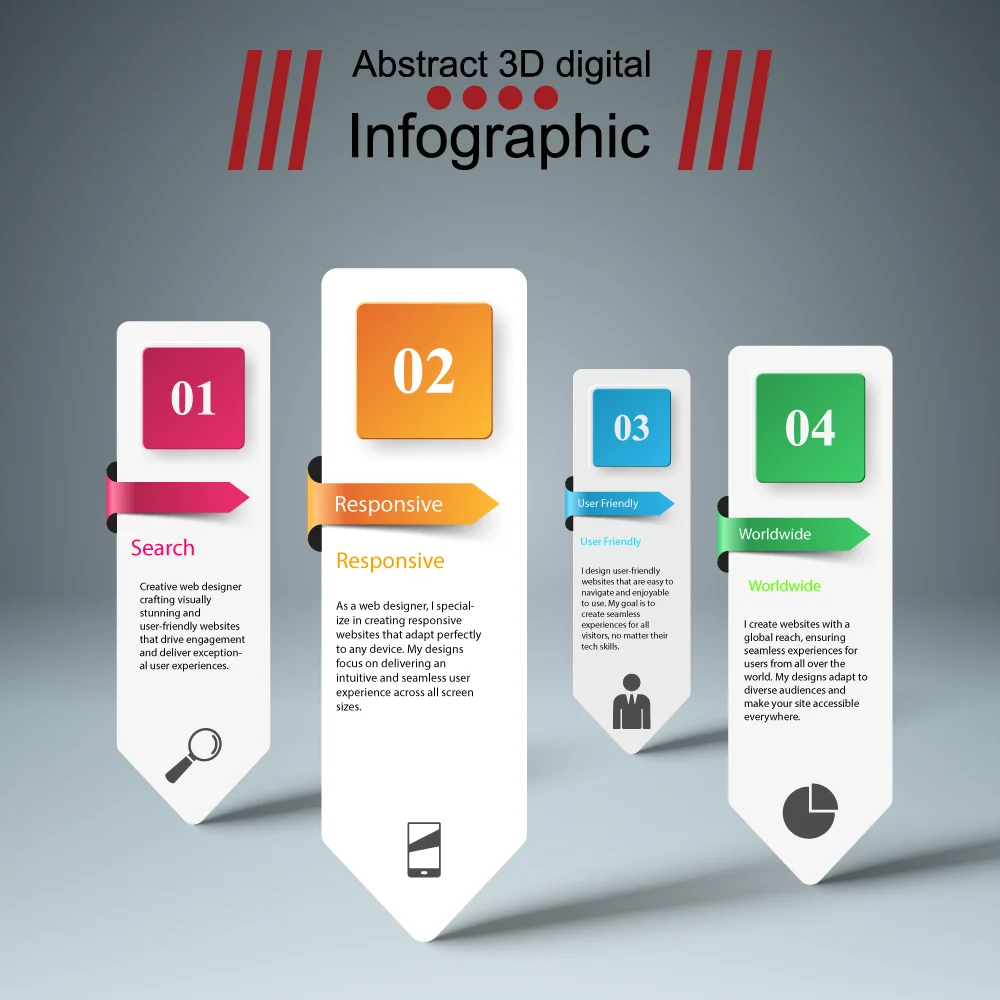
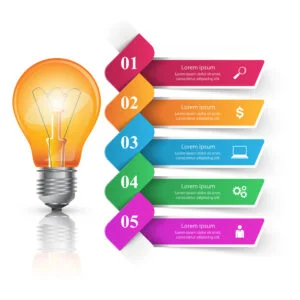
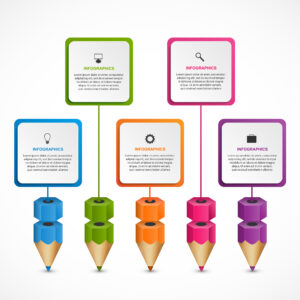
Talk about goals, who the infographic is for, and collect important information for it.
Data Analysis & Planning
Break down and arrange the data to find the best way to show it clearly and effectively.
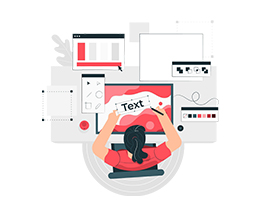
Design Creation
Create the visual design by choosing colors, icons, charts, and fonts that match the brand and message.
Client Feedback & Revisions
Show the draft to the client for their input and improve the design based on their ideas.
Final Delivery & Support
Provide the infographic in different formats and offer help or changes if necessary.
1+
Years Of Experience
Faqs
Asked Questions about Infographic Design
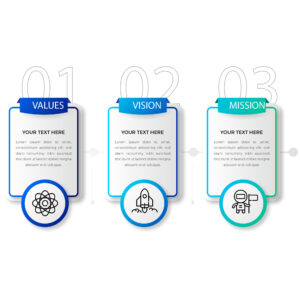
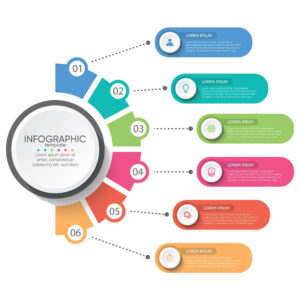
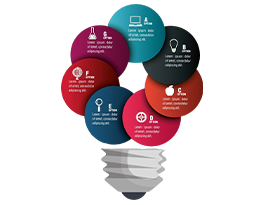
What is an infographic?
An infographic is a visual way to show information, data, or knowledge. It uses graphics, charts, and illustrations to explain complex ideas in a clear and interesting way.
How long does it take to design an infographic?
The design process typically takes 5-10 business days, depending on complexity and data representation, with more intricate designs or large projects requiring additional time.
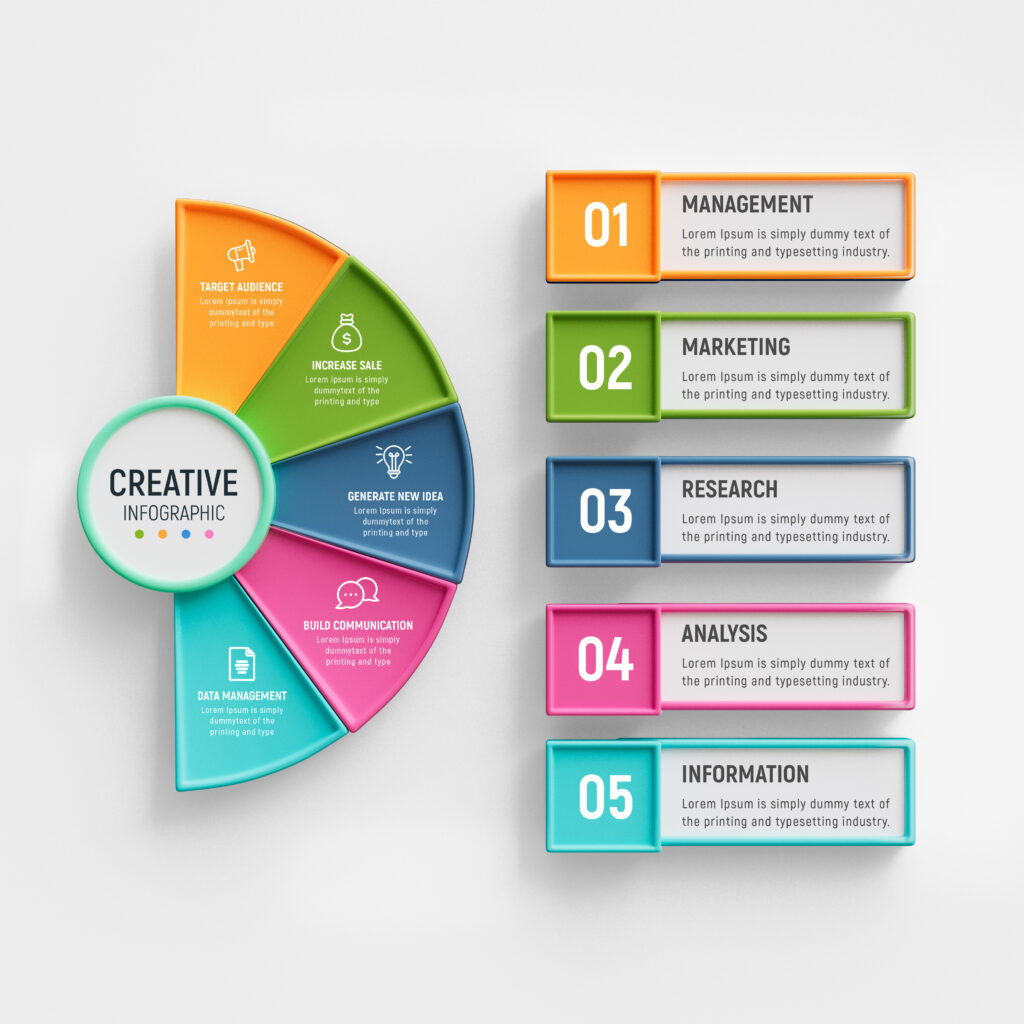
What types of infographics do you design?
We create customized infographics, including statistical, timeline, process, comparison, and geographic, to effectively communicate your message and meet your specific needs.
What file formats do you provide for infographics?
We offer infographics in various formats like JPEG, PNG, PDF, HTML5, and animated GIFs, tailored to meet your specific needs.